XYPlot Class Reference
Class for storing and retrieving simulation data as csv files.
More...
List of all members.
Public Member Functions |
| | XYPlot (QWidget *parent, QString title, QString xAxisLabel="", QString yAxisLabel="") |
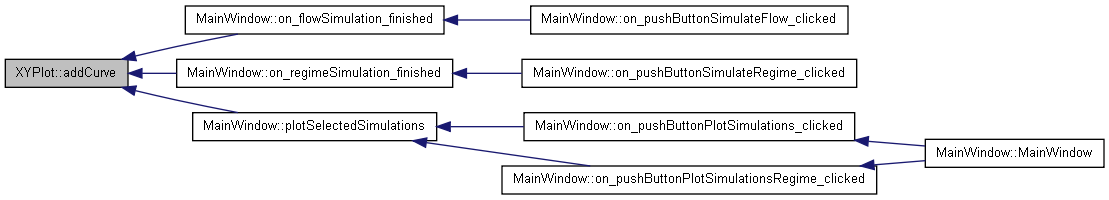
| void | addCurve (std::vector< double > xValuesList, std::vector< double > yValuesList, QString legend="") |
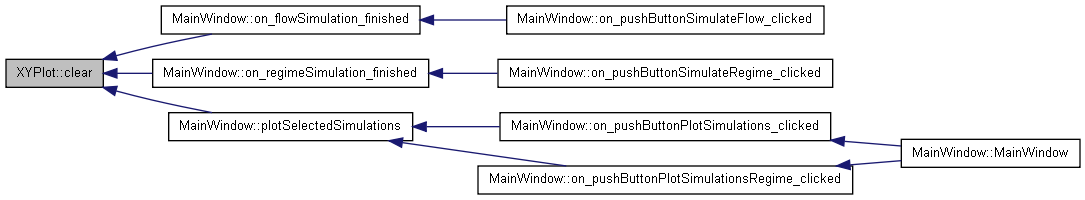
| virtual void | clear () |
| QwtPlot * | Plot () |
Public Attributes |
| QwtPlotZoomer * | zoomer |
Private Attributes |
| int | _curves |
| std::vector< QPen > | _pens |
Detailed Description
Class for storing and retrieving simulation data as csv files.
Class for creating simple plots, based on QwtPlot.
Constructor & Destructor Documentation
| XYPlot::XYPlot |
( |
QWidget * |
parent, |
|
|
QString |
title, |
|
|
QString |
xAxisLabel = "", |
|
|
QString |
yAxisLabel = "" | |
|
) |
| | |
Constructor that creates plot base with title and labels
- Parameters:
-
| parent | Parent Widget (parent window) |
| title | Title of plot |
| xAxisLabel | Label of x axis |
| yAxisLabel | Title of y axis |
Member Function Documentation
| void XYPlot::addCurve |
( |
std::vector< double > |
xValuesList, |
|
|
std::vector< double > |
yValuesList, |
|
|
QString |
legend = "" | |
|
) |
| | |
Adds a curve to plot, a plot can have an unlimited number of curves
- Parameters:
-
| xValuesList | A vector of doubles of x values for the curve |
| yValuesList | A vector of doubles of y values for the curve |
| legend | Curve legend ( |
| void XYPlot::clear |
( |
|
) |
[virtual] |
Remove all curves plotted. Reimplemented to reset _curves to zero so that curve colours are the same when starting a new plot
| QwtPlot * XYPlot::Plot |
( |
|
) |
|
Returns a pointer to the QwtPlot
Member Data Documentation
 1.6.2
1.6.2

